Making sense of the data
The usefulness of your survey data will depend on having a clear improvement programme in place and on how well you are able to make use of the data. The fundamental steps of understanding and interpreting data usually involve examination of the number and percentage of patients giving each response to a question and some analysis of data by particular groups of patients, stages of the patient journey or other information such as department or site.
Use the data to help pinpoint problems
While highlighting organisational strengths is important, it is also crucial to use the data to drive improvement where needed.
One way to focus on where improvements are needed is to analyse responses that suggest a problem with care. Also, if questions allow respondents moderate response categories (such as ‘to some extent’ or ‘sometimes’) in addition to more extreme ones (‘always’ or ‘never’), your analysis will be more powerful if you identify these moderate responses as also indicating a problem. Respondents’ use of these middling responses suggests that there is scope for improvement.
‘Drill down’ into the data
It is impossible to analyse absolutely every issue a patient survey raises. One reasonable way to control the number of analytical questions is to conduct an analysis with several stages.
The first level of analysis should be the most general, for example, measures of overall performance such as the ‘overall rating’ or ‘respect and dignity’ questions. The next level should delve into issues that underlie the summary measures – performance along particular dimensions of care, for example, or of particular units or staff. The final level should entail statistical or crosstab analysis to attempt to get at the causes of the particular issues.
Group similar questions together to provide summary analysis
Analysing questions and presenting findings in a way that is comprehensive, logical and not overwhelming is a significant challenge.
To make the data more compelling for others and to speed up the analysis we suggest:
- Linking questions that cover similar topics or processes. For example, the patient survey questionnaires usually separate questions into sections that reflect stages in the patient journey from start to finish. Do your results suggest the admissions process is working effectively but discharge or aftercare has shown some less positive responses? Alternatively you could look at an aspect such as communication and see if there is any variation in the data by different groups of staff, or by written vs. verbal communication.
- Combining several questions into a single composite measure (by averaging responses, for example). You may wish to combine the results of each questionnaire section as these usually relate to a specific stage or aspect of the patient’s care.
Standardising Data
The composition of both the samples and the respondents can vary when examining trends and correlations between surveys, even if the sampling criteria remain unchanged. Certain groups of patients respond more positively than others, such as older patients compared with younger patients; if results improve significantly from one survey to the next but the proportion of older patients has increased, the improvement may be due to a change in those responding. One solution to this issue is to “standardise” your data, i.e. to control for these variations in the population so that you can be more confident that any change reported is due to changes in service quality, not just a change in the type of patients who are responding.
If comparing two or more sets of survey results we suggest that you compare the key demographics of the respondents early in your analysis. If there are significant differences in the proportions of respondents by patient age, gender or ethnic group, you may need to standardise your data to control for variations in respondent demographics. If you are planning to do that, we strongly recommend that you seek the assistance of a statistician.
Use statistical tests to make comparisons and analyse subgroups
Statistical tests can be used to examine relationships and associations between groups (for example age, sex or ethnic categories). These tests take into account the number of responses, the variation in responses and values of the items you are comparing (such as average responses). If tests show that the differences between two groups are not statistically significant you should view the patterns of responses as only suggestive.
Additionally, regression analysis can be used as opposed to simple correlation and comparison, in that it can adjust for other things that have an impact on the overall measure of performance and it provides more precise estimates of how overall measures will change in response to improvement on individual items. Regression analysis is more complex, but, in essence, allows for a more level ‘playing field’. There are some limits to a univariate (crude) analysis so regression analysis is an attractive option for statistical analysis. As with data standardisation, we strongly recommend that you seek the assistance of a statistician if you are planning to perform statistical tests.
Calculate confidence intervals to give an indication of the uncertainty surrounding your results
Although there are many methods of describing uncertainty, confidence intervals are used most often. By taking into account the number of responses, the variation in response, and the magnitude and direction of the estimate, the confidence interval describes the range of plausible values within which the “true” value for the population is likely to fall. Remember that the estimate itself is the most likely result and this is therefore your best estimate, not the limits of the confidence interval.
- Statistical significance is the degree to which a result is substantially different than would be expected by chance alone. For example, if the difference in data for a question from two survey years is statistically significant, this means that there has been a true change in the results that cannot be attributed solely to chance.
- A confidence interval is an upper and lower limit within which you have a stated level of confidence that the trust mean (average) lies somewhere in that range. The width of the confidence interval gives an indication of how cautious we should be. A very wide interval may indicate that more data should be collected before any conclusions are made.
Make use of the free text
Patients’ comments on the back page of the questionnaire can provide valuable feedback about their experiences. Such data illustrate responses to closed questions and allow respondents to identify new issues not captured elsewhere in the questionnaire. It can be effective to group comments made about similar topics to identify themes in patients’ experiences.
Use patient feedback data with other data
Patient feedback data provides one valuable source of information about how patients experience and feel about the health services they receive. Linking feedback data with clinical data, outcomes data and routinely collected data, when done appropriately, can provide useful insights.
Perform analysis by sub-groups
You may want to compare the answer to a survey question between two different groups to see if the differences are statistically significant (e.g. the answers for men versus women, or between patients treated under different specialties). However, comparing results within your trust considerably reduces the number of responses in each group. This will impact upon the level of confidence you have in the results and, therefore, your ability to accurately detect differences between these groups. Table 1 shows the level of confidence you would achieve for various numbers of respondents.
Table 1: Confidence intervals* for different numbers of respondents
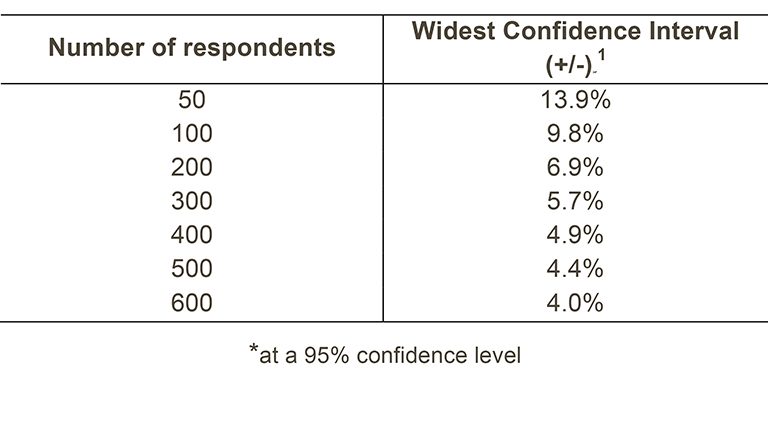
If you are interested in looking at different sub-groups within your trust population (for example, patients treated at different sites in your trust), you will need to think about the number of respondents you need in each group, and how this will impact on the confidence you can have in the results. The Survey Coordination Centre recommends a minimum of 100 respondents per group for comparison between sub-groups. Confidence intervals for analysis with groups of fewer than 100 respondents will be so large that there would be little certainty of detecting reliable statistical differences.
Example: How confident you can be in your results?
For a trust, 400 patients responded in total. Taking a particular question, of which 50% of respondents answered ‘Yes’, from Table 1 we can see that the widest confidence interval for 400 respondents would be +/- 4.9%. We would therefore be 95% confident that the true results would be between 45.1% and 54.9% – that is, if you had surveyed the entire population of inpatients at a trust.
However, if we are looking at the results for this particular question by eight different groups of patients (assuming an equal number of respondents in each region), there would only be 50 respondents in each group. If there are 50 respondents and 50% answered ‘Yes’, the confidence interval would be +/- 13.9%, so the true results could be between 36.1% and 63.9%.
Making sense of data
When analysing the data make sure to correctly group and label your findings within the program you are using, it will help with compiling and the creation of charts as well as make the dataset more approachable to others.
[1] This column (the widest confidence interval) shows the maximum margin of error for binomial estimates of proportions.